kids

Tuesday, 11 February 2014
Statistics and Probability- Bugs a Bugging Graph
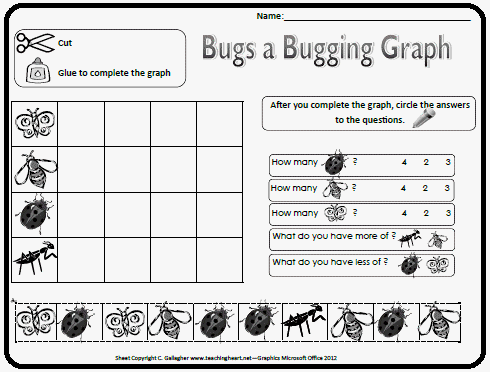
This is a worksheet picture graph that allows students to create their own graph with the data provided. Students are asked questions about the data. They also need to make comparisons by determining what there is more of between the insects. This would be a helpful tool because students in grade 2 need to understand what a pictograph is. They need to be able to create and analyze the attributes, according to the curriculum guide for grade 2 math outcome SP2.1.
Subscribe to:
Post Comments (Atom)

No comments:
Post a Comment